
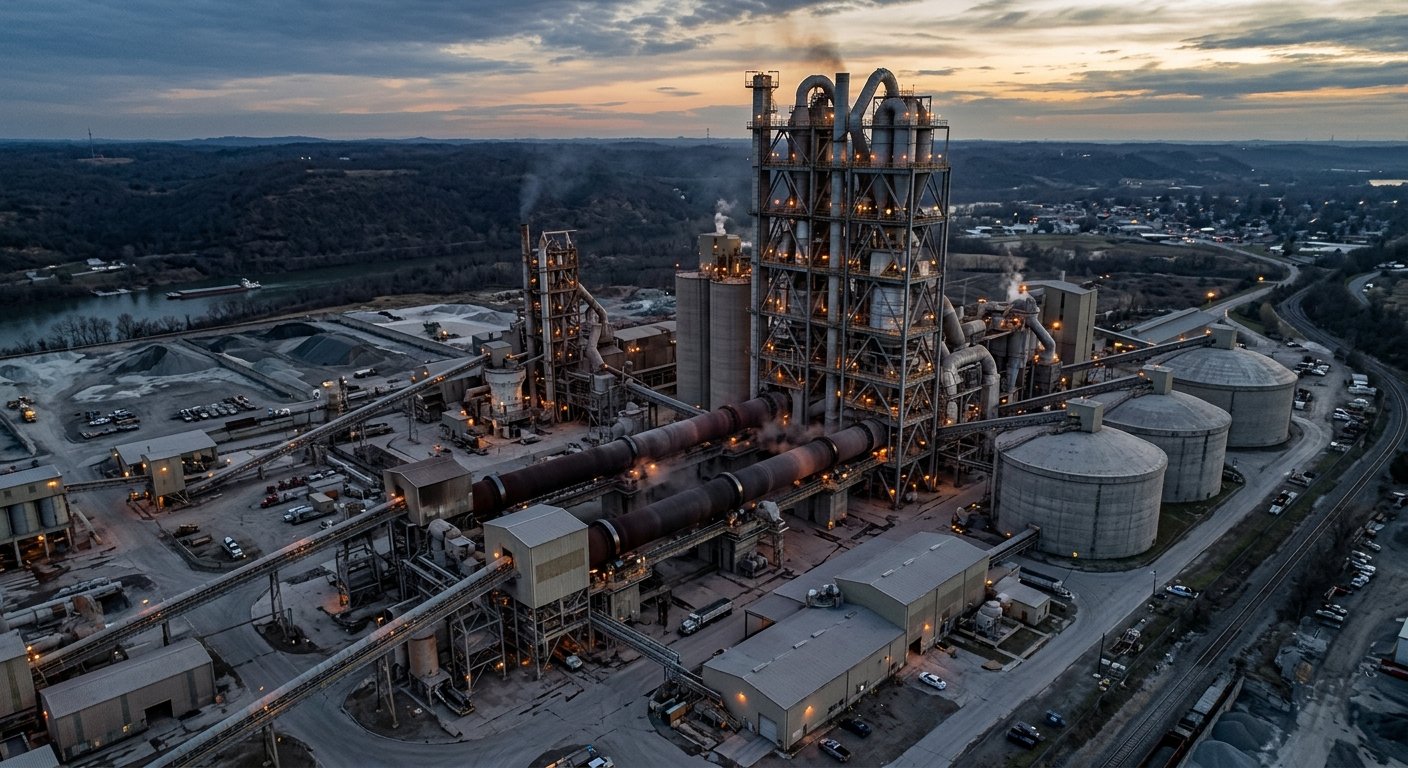
The Global Cement Industry: Production, Geography, Trends
Global cement production reached ~4.1 Gt in 2023, China ~50%, India #2. Demand drivers, the decarbonisation challenge, and structural trends.
Global cement production was approximately 4.1 billion tonnes in 2023, making cement the most widely produced industrial mineral in the world by mass [1]. Output is geographically concentrated in Asia, driven by construction demand and proximity to limestone reserves, and the industry accounts for roughly 7-8% of global CO2 emissions, a share that makes decarbonisation one of the defining engineering challenges of the coming decades [2][3].
How large is the global cement industry?
The global cement manufacturing industry produced approximately 4.1 billion metric tonnes in 2023, per the USGS Mineral Commodity Summaries 2025 [1]. Preliminary estimates for 2024 are in the 3.8-4.0 Gt range, reflecting reduced output from China as its property sector contracts [4]. For scale, cement production volumes dwarf steel (~1.9 Gt/yr) and aluminium (~70 Mt/yr); no other bulk industrial material is produced in comparable quantity.
Cement: a hydraulic binding agent produced by grinding clinker (the product of high-temperature limestone calcination) with gypsum and, in blended cements, supplementary cementitious materials. Distinct from concrete, which is cement combined with aggregates and water. For a step-by-step explanation of how cement is made, see cement manufacturing process explained.
Cement is a commodity with near-zero transport arbitrage over long distances. A tonne of cement is heavy, low-value per kilogram, and expensive to move. More than 90% of cement produced anywhere in the world is consumed within roughly 300 km of the plant that made it. Production geography, therefore, mirrors construction geography almost exactly.
Which countries produce the most cement?
China produces approximately 2.0-2.1 billion tonnes per year, roughly half of global output; India is the second-largest producer at approximately 410-450 Mt/yr [1][4][5]. Together they account for over 60% of world production.
| Country | Estimated production (Mt/yr, 2023) | Share of global output | Notes |
|---|---|---|---|
| China | ~2,000-2,100 | ~50% | Declining from ~2.4 Gt peak c.2020; property-sector contraction |
| India | ~410-420 | ~10% | Fastest-growing major market; capacity additions accelerating |
| Vietnam | ~100-110 | ~2.5% | Third-largest by some rankings; significant export role |
| Turkey | ~82-85 | ~2% | Major exporter to Europe and MENA |
| Iran | ~60-70 | ~1.5% | Domestic demand and regional export |
| Brazil | ~55-60 | ~1.4% | Largest in South America |
| United States | ~88-90 | ~2.2% | Predominantly domestic consumption; net importer |
| Rest of world | ~350-400 | ~9-10% | Distributed across Europe, Africa, SE Asia, Latin America |
Sources: USGS Mineral Commodity Summaries 2025 [1]; Statista global cement production data [5]; World Population Review [6]. Figures are estimated; country-level reporting methodologies differ.
China's dominance reflects a multi-decade infrastructure and residential construction cycle that has now passed its peak. Chinese cement demand is expected to decline slowly through 2030 as the property sector deleverages. India, by contrast, is in an earlier phase: per-capita cement consumption is around 250 kg/yr (versus China's peak of ~600 kg/yr), and capacity additions by producers such as UltraTech and Adani Cement / ACC are running at 20-30 Mt/yr. The India story is the primary upside scenario for global cement demand through 2040.
What drives cement demand?
The primary demand driver for cement is construction activity, particularly residential and infrastructure investment in developing economies. Demand correlates closely with GDP per capita in the USD 1,000-10,000 band; above USD 20,000 per capita, cement intensity per unit of GDP flattens as the built stock matures.
Three demand vectors account for nearly all volume growth:
- Urbanisation. Population migration from rural areas to cities requires housing, roads, water infrastructure, and public buildings. The urbanisation wave in South and Southeast Asia and Sub-Saharan Africa is the structural demand driver for the next 25 years.
- Infrastructure investment. Ports, power plants, highways, dams, and transit systems require large volumes of concrete. Government infrastructure spending cycles are the most volatile component of cement demand and can swing national consumption by 10-15% in a single year.
- Industrial construction. Factories, logistics parks, and energy facilities are a smaller but growing share of cement demand in economies transitioning up the industrial value chain.
IEA and GCCA project global cement demand to rise 12-23% between now and 2050, even accounting for China's structural decline, on the strength of Global South growth [2][3]. India, Sub-Saharan Africa, and Southeast Asia are the projected growth engines.
The decarbonisation challenge
Cement production accounts for approximately 7-8% of global CO2 emissions, with roughly 60% of those emissions arising from the chemical decomposition of limestone rather than from fuel combustion [2]. This distinction matters for understanding why cement is hard to decarbonise.
When limestone (CaCO3) is heated in the kiln, it decomposes: CaCO3 becomes CaO (lime) plus CO2. That reaction releases approximately 0.53 tonnes of CO2 per tonne of clinker produced, regardless of what fuel is burned or how efficiently the kiln operates. Switching from coal to gas or biomass reduces fuel-combustion emissions but does not touch the process emissions.
Current global average emissions intensity is approximately 0.6 t CO2 per tonne of cement (lower than per tonne of clinker because blended cements dilute the clinker content with supplementary cementitious materials) [2]. The GCCA's GNR database reports a 25% reduction in CO2 intensity per tonne of cementitious product since 1990, achieved through fuel switching, clinker-ratio improvement, and efficiency gains [7].
The decarbonisation levers available to plant operators and engineers are:
- Clinker substitution. Replacing a fraction of clinker with supplementary cementitious materials (fly ash, slag, calcined clay) reduces both cost and CO2/tonne of cement. See also OPC vs PPC vs PSC cement types.
- Thermal efficiency improvement. Reducing specific fuel consumption narrows the fuel-combustion share of total emissions. See specific fuel consumption in cement kilns for the benchmark analysis.
- Alternative fuels. Co-processing of waste-derived fuels (tyre-derived fuel, biomass, municipal waste fractions) displaces fossil fuel CO2.
- Carbon capture and storage (CCS). The only technology that directly addresses process emissions; at pilot or early-commercial stage at several European plants as of 2025.
The industry's EU ETS compliance burden and India's PAT (Perform, Achieve, Trade) energy intensity scheme both increase the financial pressure on plants to reduce emissions intensity. Oswal's sustainability commitments are shaped by the same decarbonisation frame.
Structural trends shaping the industry
Three structural trends are reshaping the global cement industry in the 2020s: capacity consolidation, the rise of blended cements, and intensifying focus on kiln efficiency.
Consolidation. A small number of multinationals (Holcim, HeidelbergMaterials, Cemex) and Chinese state-owned producers account for a growing share of global clinker capacity. Consolidation improves capital efficiency and R&D investment but puts cost pressure on independent regional producers.
Blended cements. PPC (Portland Pozzolana Cement), PSC (Portland Slag Cement), and LC3 (Limestone Calcined Clay Cement) are growing as replacements for OPC, driven by both cost and carbon-intensity incentives. This trend reduces per-tonne clinker demand relative to cement output and is already visible in India's product mix.
Kiln efficiency and false air control. As carbon costs and fuel prices rise, plant managers are paying closer attention to specific heat consumption and false air ingress. Every percentage point of false air above baseline adds measurable thermal energy cost by increasing the volume of gas the ID fan must move and degrading preheater efficiency. Modern plants are installing continuous false air monitoring and upgrading kiln-seal systems as part of efficiency programmes.
Waste heat recovery (WHR). ORC and steam-Rankine systems on preheater and cooler exhaust are standard equipment on new kilns in China and India. A 5,000 t/day line can generate 4-9 MW of electrical output from exhaust streams, directly reducing purchased-electricity cost.
Common questions about this topic
Global cement production was approximately 4.1 billion tonnes in 2023, per the USGS Mineral Commodity Summaries 2025 [1]. Preliminary 2024 estimates are in the 3.8-4.0 Gt range, reflecting a decline in Chinese output. China accounts for roughly 50% of global production and India for approximately 10%. For context on how cement is produced, see the cement manufacturing process.
Approximately 60% of cement's CO2 emissions come from the chemical decomposition of limestone during clinker production, a reaction that cannot be avoided by switching to cleaner fuels [2]. Only carbon capture and storage (CCS) or the use of alternative binders that avoid limestone calcination (such as calcined clays in LC3 cement) address those process emissions directly. Fuel-combustion emissions can be reduced through efficiency improvements and alternative fuels, but they account for the smaller portion of total emissions. Understanding the role of clinker in cement manufacturing is the starting point for grasping this constraint.
India, Sub-Saharan Africa, and Southeast Asia are the projected growth engines for global cement demand through 2050, driven by urbanisation, infrastructure investment, and rising per-capita incomes [2][3]. IEA and GCCA project global cement demand to rise 12-23% to 2050 despite structural decline in Chinese output. India alone is expected to more than double annual cement output over the period, given current per-capita consumption levels well below China's historical peak.
Sources
- U.S. Geological Survey (USGS), *Mineral Commodity Summaries 2025: Cement*, January 2025
- International Energy Agency (IEA), *Cement* (energy system analysis page), 2024
- IEA and GCCA, *Technology Roadmap: Low-Carbon Transition in the Cement Industry*, 2018 (with subsequent updates)
- U.S. Geological Survey (USGS), *Mineral Commodity Summaries 2026: Cement*, January 2026
- Statista, *Global cement production volume*, 2024 dataset
- World Population Review, *Cement Production by Country 2026*
- Global Cement and Concrete Association (GCCA), *Global cement industry reports 25% CO2 intensity reduction*, press release, 2023
Related Articles
Discuss Your Sealing Requirements
Our engineering team can help identify the right sealing solution for your application.
Contact Engineering Team“Wherever high-temperature rotary kilns operate under controlled atmosphere, Oswal sealing systems ensure energy efficiency and process stability.”